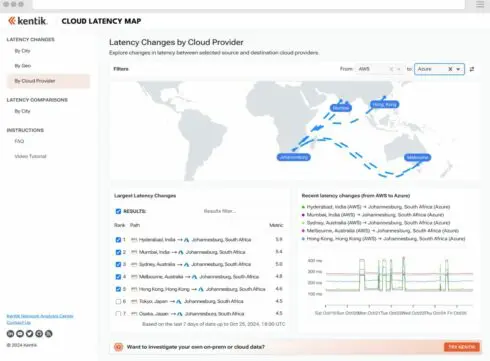
Network observability platform Kentik today released Cloud Latency Map, a free tool that provides insights into latency in over 100 different cloud regions around the world.
According to Doug Madory, director of internet analysis at Kentik and the creator of the Cloud Latency Map, this new tool can help IT teams determine if a connectivity issue is present in one of those regions.
“Since the public clouds rely on the same physical infrastructure as the rest of the global internet, the map can often pick up on the latency impacts of a variety of failures of core infrastructure, such as the loss of a major submarine cable,” he said.
By default, the dashboard shows the areas with the largest latency changes as well as a list of the most recent latency changes over the last seven day period. Data can be further filtered by city, larger geographical region, or cloud provider.
Cloud Latency Map also allows users to compare the latencies between eight different cities: Washington, Singapore, Sydney, Sao Paulo, London, San Francisco, Tokyo, and Mumbai.
“We decided to use these eight major cities as a benchmark for comparing latency because each of the clouds had a robust region in each of these locations. Since the distance between any two cities is the same for each cloud (give or take a few kilometers), then comparing the observed latency is a fair comparison. Any observed differences would be due to differences in how traffic is routed from one region to another,” the Cloud Latency Map FAQ states.
To build the map, Kentik uses live measurement data from over 100 cloud agents hosted by AWS, Microsoft Azure, Google Cloud, Oracle Cloud Infrastructure, and IBM.
According to Kentik, customers will benefit from the fact that Kentik is an agnostic third-party not tied to one particular cloud provider.
“This newfound data can help digital businesses optimize their multi-cloud networks and identify impacts to cloud connectivity,” the company wrote in its announcement.


