OpenObserve, or O2, is a simplified observability platform that is designed as an easier-to-use version of tools like Elasticsearch, Splunk, or Datadog.
According to the project maintainers, it is very easy to get started using O2, and it can be set up in under two minutes.
It supports observability data types like logs, metrics, and traces, and has full compatibility with OpenTelemetry for those data types.
“Its GUI is not only user-friendly but also advanced, facilitating the management of various systems and various types of observability data. Think of it as an amalgamation of Prometheus for metrics, Elasticsearch for logs, Jaeger for traces, and Grafana for dashboards, all in one place,” the project website states.
O2 also provides real user monitoring capabilities, such as performance tracking, error logging, and session replay.
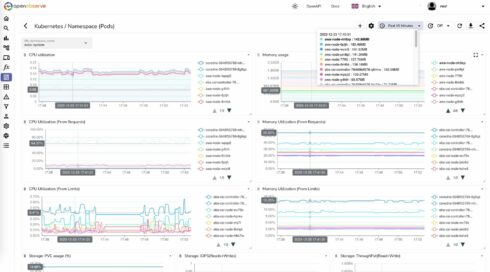
It offers dashboards to monitor observability data, and there are over 14 different chart types for visualizing data.
According to the maintainers, users can also lower their log storage costs by 140x using O2 compared to Elasticsearch. It supports a variety of storage options, including local disk, S3, MinIO, GSC, and Azure Blob Storage.
Other key features include SQL support, advanced query functions, alerts, dynamic schema, and built-in authentication.
As of September 2024, the project had over 11K stars on GitHub and 63 contributors.
“If you are looking for an observability tool for logs, metrics, and traces, take a look at OpenObserve and how its approach towards observability could help you build better software and save money on observability costs,” Prabhat Sharma, founder of OpenObserve, wrote in a blog post.
Read about other recent Open-Source Projects of the Week:
Authentik | Dapr | Infisical | Cloudforet | Maestro | Snipe-IT