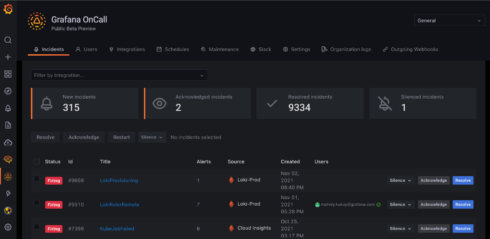
Grafana Labs has announced new updates to its observability platform, such as Grafana OnCall and Grafana Enterprise Traces.
Grafana OnCall is an on-call management tool that came about because of the company’s acquisition of Amixr. It can be used to easily create and manage on-call schedules. It is designed to allow for faster resolution times because teams won’t have to manage alerts from separate tools, such as Grafana, Prometheus, and Alertmanager. Having a single tool to view alerts in lowers the risk of missing an important update and reduces time spent responding to notifications.
It can be integrated into existing Grafana Cloud deployments and works with existing alerting sources and monitoring tools.
Key features of Grafana OnCall include customizable execution policies, a Google Calendar-based workflow, integration with Slack, and automated grouping.
It is currently available in beta for Grafana Cloud users, and general availability is expected for early 2022.
Grafana Enterprise Traces (GET) is available as part of Grafana Enterprise Stack. Along with Enterprise Metric and Enterprise Trace, GET allows users to jump from metrics, logs, and traces within Grafana.
With GET, users can access relevant trace data and administrators can manage permissions and settings to grant role-based access to resources right from within the Grafana interface.
Other updates from the company include:
- Loki 2.4
- Tempo 1.2
- Recorded queries
- Cardinality analysis
- AWS CloudWatch integration
- Kubernetes monitoring improvements
- K6 capability updates
More information about these updates can be found here.


