Most security teams do not fail because they have no logs. They fail because the useful logs become too expensive to keep, too slow to search, or too fragmented to trust when an incident starts.
That is the real SIEM problem: not collection, but economics, latency, and context.
At SOFTSWISS, this problem is not theoretical. We operate in a real-time, regulated, high-risk iGaming environment: 24/7 availability, high transaction throughput, strong fraud pressure, frequent releases, and multiple regulatory footprints. Across different products, technology stacks, and maturity levels, security analytics has to work under conditions where delay quickly becomes operational risk.
But this is not only an iGaming problem.
Fintech, SaaS platforms, marketplaces, telecoms, digital banks, payment companies, and large e-commerce businesses are moving in the same direction: more telemetry, longer retention needs, faster investigations, tighter budgets, and less tolerance for blind spots.
The focus here is the layer underneath day-to-day security operations: the data architecture that makes fast detection, long-term context, and sustainable economics possible.
Our answer was a data-first architecture: open-source collection, disciplined schema management, tiered retention, detection-as-code, and a columnar analytical backend capable of handling security telemetry at scale. In our case, that backend is ClickHouse.
The question we were really trying to answer
The starting question was not “which SIEM should we buy?”
The better question was: How do we keep enough security data, query it fast enough, and still make the economics work?
That distinction changes the architecture.
A traditional SIEM-centred approach often starts with the tool and then negotiates around its limits: ingestion cost, retention cost, indexing cost, archive cost, search performance, and analyst access. In high-volume environments, this can quietly push teams into bad compromises. They filter aggressively before ingestion. They shorten retention. They move older data into archives that are technically available but operationally slow. They split data across systems and then lose the ability to ask one coherent question during an investigation.
We wanted the opposite: a single security dataset that could support detection, search, correlation, baselining, investigation, dashboards, and evidence.
That is the role of the security data lake in our architecture.
The shape of the platform
The core of the platform is a three-node analytical cluster inside our security domain. Data reaches it through two main paths.
Vector collectors handle network devices, NGFW exports, SaaS and PaaS audit logs, Kubernetes telemetry, and other infrastructure sources. For product-side telemetry, the analytical backend consumes from Kafka clusters already operated by product teams.
That second path is important. We deliberately did not build a separate Kafka estate inside the security team. Kafka is a serious operational commitment: brokers, coordination, schema management, monitoring, capacity planning, upgrades, and incident ownership. If the data is already flowing through product Kafka clusters, we prefer to consume from there rather than duplicate the transport layer.
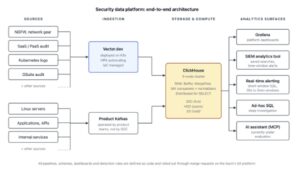
Figure 1. Security data platform: end-to-end architecture.
Inside the data lake, events move through several stages.
Raw tables receive the firehose. Buffering absorbs small and bursty writes. Materialised views do the heavy lifting: the first layer handles technical normalisation – parsing, casting, and field extraction – while the second layer maps events into a unified semantic schema that analysts and detection engineers can actually use. Distributed tables provide SELECT-side fan-out across the cluster.
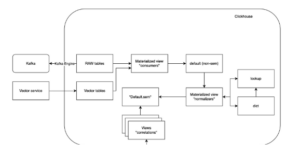
Figure 2. Normalization and correlation pipeline.
Tables, views, Vector pipelines, connector definitions, dashboards, and detection logic are managed as code and rolled out through merge requests. There is no acceptable “quick fix directly in production” path. That sounds strict until the first time a parser change silently breaks a field used by ten detections. At that point, version control is not bureaucracy. It is resilience.
Storage is where SIEM economics usually break
Security data is expensive because it grows in every direction at once.
You need hot data for live alerting and fast investigations. You need warm data for trend analysis, incident scoping, and historical correlation. You need cold data for compliance, audit, long-tail investigations, and retrospective threat hunting. Each layer has different performance and cost requirements.
Our model uses tiered storage.
Hot data lives on local SSD for the shortest, most operationally sensitive window. Warm data moves to HDD for investigation and trend analysis. Cold data is offloaded to S3-compatible object storage for longer-term retention, compliance, and long-tail search.
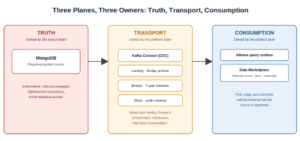
Figure 3. Storage tiers and lifecycle.
Lifecycle movement is handled through table-level TTL rules. Replication and coordination are handled by dedicated coordination nodes with SSD-backed logs. This detail matters. At high throughput, coordination latency can become a database problem very quickly.
The business result is more important than the storage design itself: we can keep more useful security context within reach without treating every retained byte as premium SIEM data.
The numbers that matter
On our workload, this architecture gives us high compression, fast analytical queries, and practical long-term retention. Internally, the platform supports real-time monitoring above 700,000 events per second, retains 100TB+ of security data, and has produced more than $300,000 per year in cost optimisation compared with more vendor-heavy approaches. These are SOFTSWISS internal measurements; the detailed methodology is available under NDA and should be treated as workload-specific rather than universal.
Public benchmarks and migration stories broadly point in the same direction: for large analytical workloads, columnar storage, compression, and query execution can materially reduce the cost of retaining and analysing high-volume data. We treat those numbers as directional rather than universal. The only benchmark that matters in production is your own workload: event shape, cardinality, query patterns, retention requirements, burst behaviour, hardware, indexing strategy, and analyst workflows.
The comparison below shows the direction we saw when evaluating a vendor-heavy ELK-style baseline against our own data-first security analytics architecture. It is not a universal ELK benchmark.
| Metric | ELK-style baseline | Our data-first architecture |
| Compression ratio on security logs | ~1.5:1 | ~10–20:1 on our normalised security logs |
| p99 query latency on 7-day investigation window | ~30–90 s | ~0.5–3 s |
| Practical retention model | Short hot retention, with older data becoming slower or more expensive to query | 7 days on SSD, 90 days on HDD, 1+ year on S3-compatible storage |
| Hardware footprint for comparable workload | 12+ nodes | 3 analytical nodes + 3 dedicated coordination nodes |
| Annual infrastructure cost, indexed | 100 | ~30–40 |
The point is not that every team will reproduce these numbers. The point is that, at high telemetry volume, storage model, compression, query execution, and retention design can change what the security team can afford to keep and investigate.
For security, that changes the nature of the questions you can ask.
Three months of full-fidelity firewall logs one SQL query away changes how an analyst scopes an incident. A year of retained authentication telemetry changes how detection engineers build baselines. Long-term access to normalised infrastructure and application events changes how quickly the team can move from one suspicious signal to a pattern.
Cost is the headline. Context is the real value.
Search and analytics should not live in separate worlds
Security investigations rarely follow one query pattern.
An analyst may start with a concrete token – an IP address, hash, hostname, username, domain, user-agent fragment, process name, file path, session identifier, API key fragment, transaction reference, internal user ID, or indicator of compromise – and then immediately move into aggregation, joins, baselining, and historical comparison.
A token, in this context, is simply a searchable fragment inside a log or event. It is not an abstract AI concept. It is the concrete thing an analyst uses to pivot: “show me every place this IP, user, host, path, hash, or session identifier appears.”
That distinction matters.
An analyst sees a suspicious IP in an authentication log. The next questions are immediate: where else did this IP appear? Which users touched it? Which services saw it? Was it connected to a new device, a new country, a failed payout flow, or a privileged action? Did it appear before the current incident window?
That workflow is not pure search and not pure analytics. It is both.
In our environment, ClickHouse has become practical for many SOC-style token searches while preserving the analytical model we need for correlation and long-retention investigation. The point is not to turn the data lake into a search product. The point is to let analysts pivot from a concrete signal to broader context without moving between disconnected systems.
You search for an IP, then aggregate by user. You search for a user agent, then join it with device history. You search for a domain, then compare it against historical DNS activity. You search for a token, then ask whether it appears in authentication, API, network, Kubernetes, and SaaS audit data at the same time.
The better question is not “can this backend search logs?”
The better question is: Which parts of the security workflow need fast token search, which parts need analytical correlation, and can both run over the same security dataset?
That is the important shift.
Search is not a separate island. It sits next to aggregations, joins, baselines, detections, dashboards, and historical context. That is what makes a security data lake operational rather than just cheap storage.
Detection logic over one security dataset
A security data lake has no value if it only stores history. It has to support decisions.
Our platform supports two main types of detection logic.
The first is Sigma. Sigma gives detection engineers a portable detection-as-code format and a common way to express known patterns. We compile Sigma rules into SQL through our own conversion service, built on top of pySigma and other components. The second is hand-written SQL for cases where Sigma is too generic: complex joins, behaviour over time, multi-source correlation, entity context, or detection logic specific to our environment.
This combination is important because high-volume security work rarely fits neatly into one detection language.
Sigma is useful for portability and rule discipline. SQL is useful when the question becomes more contextual:
Has this user ever logged in from this country before?
Did this device appear only after a credential reset?
Is this payout-related action connected to a new IP, a new browser fingerprint, and a recent failed authentication burst?
Is this admin action normal for this service account, this time window, and this product environment?
These are not just alerting questions. They are data questions.
The advantage of this model is that detections run close to the data, over normalised telemetry, with historical context available in the same analytical backend.
Where analytics becomes operational
Real-time alerting is where the data lake stops being an archive.
Our alerting service runs short-window queries against the analytical backend, usually over windows from 30 seconds to several minutes, and emits events into the incident messenger and automation layer. Because the queries hit the same backend that holds historical context, an alert can compare live behaviour against weeks or months of prior activity.
That changes the quality of alerts.
A basic rule says: “user logged in from a new country.”
A better rule asks: “is this a country the user has never used in the last 18 months, from a device first seen in the last hour, after a sequence of failed login attempts, followed by a sensitive action?”
That is the difference between event detection and context-aware detection.
And it only works if the data architecture can support it at speed.
Operating the data platform, not just querying it
The hard part of this architecture is not writing the first query. The hard part is operating the platform when it becomes critical infrastructure.
We monitor ingestion rates by source, materialised-view lag, query latency distributions, replication lag, node health, disk usage, coordination latency, and the number of parts per partition. The last metric is not glamorous, but it matters. The backend does not like uncontrolled small inserts. If batching drifts, parts grow, merges suffer, and performance follows.
That is one of the reasons we do much of the transformation through materialised views rather than introducing a separate stream-processing layer for every normalisation task. It reduces moving parts. It keeps parsing, enrichment, and semantic mapping closer to the storage and query engine. It also means the team has to be disciplined with SQL, schema design, and deployment testing.
Enrichment once, not every time an analyst asks
One of the design principles we follow is to enrich data on the way in, not repeatedly at read time.
User-defined functions and materialised views allow us to enrich events with GeoIP context, threat-intelligence matches, internal token decoding, and entity-resolution logic before analysts query the data. By the time detection logic queries the data, fields such as country code, entity mapping, or IOC verdict are already present as columns.
That matters for speed, but also for consistency.
If every analyst enriches data differently at read time, the same investigation can produce different answers. If enrichment is part of the data pipeline, the logic is visible, reviewable, versioned, and repeatable.
This is one of the less glamorous advantages of treating security schemas as code. You do not only preserve data. You preserve meaning.
AI can shorten the path to a query – but not to accountability
We are evaluating controlled AI-assisted query workflows where an analyst can ask a natural-language question and receive a generated SQL query against approved, read-only datasets.
The assistant should be a faster keyboard, not a decision-maker. Humans still acknowledge, triage, and own real alerts.
This distinction is essential.
In this context, AI is useful when it shortens the path from uncertainty to evidence. It should not replace human judgement, triage, or accountability.
A junior analyst asking “show failed VPN logins from the last 24 hours grouped by country and compare them with last week” should not need to master every SQL function before they can start investigating. But the system must still control what data can be queried, which queries can be run, and how results are interpreted.
AI-assisted investigation should reduce friction. It should not reduce accountability.
Where this model may not be the right fit
This architecture is not a universal recommendation.
If a team has moderate log volume, short retention needs, limited data engineering capacity, and strong dependence on packaged analyst workflows, a managed SIEM may be the more practical choice.
If the main requirement is document-style search, case management, investigation notes, compliance reporting, and out-of-the-box SOC workflows, replacing that experience with raw SQL would be a mistake.
A security data lake model makes the most sense when the main pressure is high-volume telemetry, long-term retention, analytical correlation, cost control, and the ability to treat security data as an engineering system. It is less attractive when the organisation cannot own the operational complexity that comes with that control.
That is the trade-off: less licensing gravity, more engineering responsibility.
What still hurts
A data-first security architecture is an engineering trade-off, not a shortcut.
First, analysts need SQL literacy or good abstraction layers. SQL is powerful, but it changes the skill profile of the team. You cannot assume every SOC analyst will be productive on raw SQL from day one.
Second, database expertise matters. Partitioning, batching, materialised views, merge behaviour, coordination, retention tiers, and query design all affect operational reliability. This is not a “deploy and forget” stack.
Third, governance becomes difficult at scale. Once the platform holds thousands of tables and views, the team needs to know where columns came from, who owns them, which parser created them, whether the meaning changed, and whether a detection depends on them. We are evaluating governance and catalogue options for lineage, ownership, and data-quality controls.
Fourth, analyst UX still has to be designed. The data lake can be the analytical backend, but analysts need workflows: saved searches, dashboards, alert review, investigation pivots, query templates, documentation, and safe access patterns.
These trade-offs do not weaken the case for this model. They make the case more credible.
Open source does not remove cost. It changes where the cost lives: less licensing gravity, more engineering ownership.
In our environment, that trade-off is acceptable because it gives the security team more control over the questions we can ask, the data we can retain, and the economics we can defend.
The broader lesson
Modern cybersecurity is becoming a data engineering problem as much as a detection problem.
The team that cannot afford to retain context will miss patterns.
The team that cannot query fast will lose time.
The team that cannot govern its telemetry will eventually stop trusting it.
iGaming makes this visible earlier, but it is not unique to iGaming. The same pressure is now spreading across the wider digital economy.
The future of security analytics is unlikely to be one monolithic SIEM doing everything equally well.
A more realistic model is a data-first security architecture: open where possible, engineered carefully, governed seriously, and fast enough to support real decisions under pressure.
The real metric is not how many logs you collect.
The real metric is how quickly the business can ask a hard security question and get an answer it can act on.